Homelab as Production/Part 5 of 16
Observability Before Applications
Why you instrument the cluster before deploying anything else
Observability Before Applications
There’s a temptation when you’ve just built a Kubernetes cluster to immediately start deploying applications. You have FluxCD reconciling. MetalLB handing out IPs. Ingress working. The cluster is alive, so ship something.
Resist that temptation.
The monitoring stack went in before the first application in this build. Before Wiki.js, before n8n, before anything you’d call user-facing. That decision paid off within days, when a circular dependency in the Flux Kustomization chain caused a silent deployment failure that would have been nearly invisible without Prometheus metrics.
The principle is simple: you cannot fix what you cannot see. And the first time you deploy an application to a fresh cluster is when you most need to see what’s happening.
Metrics are a blessing and a curse. Too much and you miss what’s important; too little or none and you have no idea what’s happening. I was in the latter category. There were machines hitting limits constantly, and I was able to ask Claude about the specifics and understand why certain metrics were spiking. Having key metrics available on my Homepage dashboard made it even easier to get a general sense of system health at a glance.
The debugging argument
Here’s the argument against “I’ll add monitoring later.”
When you deploy your first application, it will probably fail. Maybe a PVC won’t mount. Maybe the container image can’t pull. Maybe the ExternalSecret doesn’t sync because the ESO ClusterSecretStore isn’t ready yet. Maybe the ingress is misconfigured and returning 502 errors.
If you have Grafana open, you immediately see:
- Pod restart counts spiking
- CPU and memory pressure on nodes during the deployment race condition
- HTTP error rates from ingress-nginx
- Log lines from the failing pod (if Loki is running)
Without Grafana, you’re running kubectl describe pod and kubectl logs by hand, comparing timestamps, guessing at causality. It works, but it’s slow, and every outage becomes an archaeology project.
The monitoring stack is the debugging interface for everything that comes after it. Install it first.
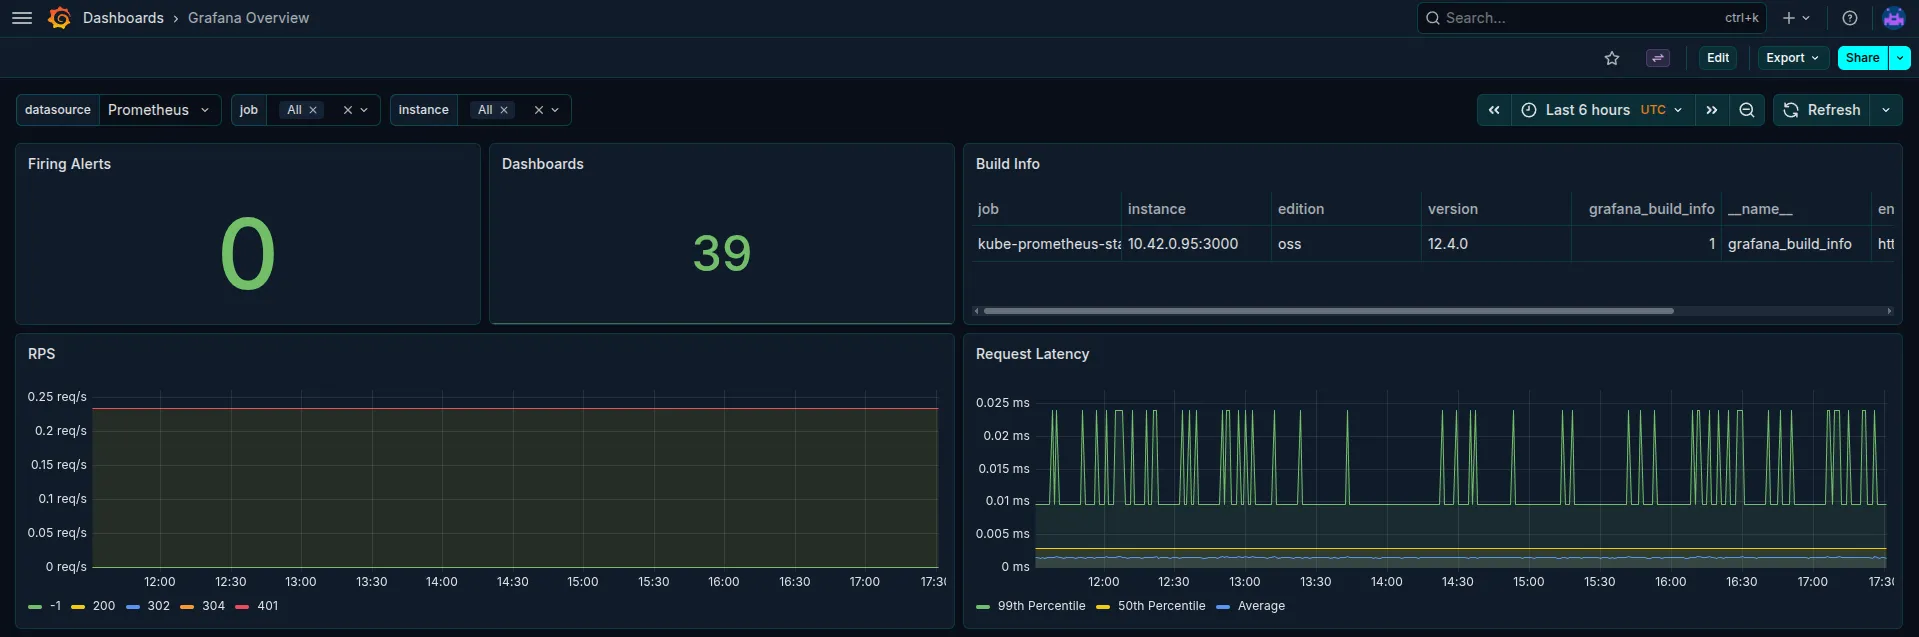 Grafana’s own health dashboard immediately after deploying kube-prometheus-stack. 0 alerts firing, 39 dashboards available, all before a single application was deployed.
kube-prometheus-stack: the opinionated all-in-one
The choice here was kube-prometheus-stack. This is a Helm chart that bundles Prometheus, Alertmanager, Grafana, kube-state-metrics, the Prometheus node exporter, and a suite of recording rules and alerting rules for Kubernetes, all pre-wired together.
The alternative is to run each component separately: install Prometheus from the prometheus-community/prometheus chart, install Grafana from the grafana/grafana chart, wire up the datasource, configure scraping targets, build the alerting rules yourself. This is instructive if you’re learning. It’s unnecessary if you want a working monitoring platform.
kube-prometheus-stack ships with roughly 20 pre-built Grafana dashboards for cluster health: node exporter metrics, pod resource usage, kubelet statistics, CoreDNS latency, API server request rates. Enabling them requires a single flag in the Helm values:
defaultDashboardsEnabled: trueWith that set, the cluster is instrumented at deployment. You open Grafana and immediately have visibility into node CPU, memory pressure, disk I/O, and pod-level resource consumption, all before you’ve written a single custom query.
The chart is deployed as a Flux HelmRelease in kubernetes/platform/monitoring/controllers/kube-prometheus-stack/. It lives in the monitoring-controllers Kustomization, which is the first thing the monitoring dependency chain reconciles.
Loki and Promtail: logs alongside metrics
Metrics tell you that something is wrong. Logs tell you why.
Grafana Loki is a log aggregation system designed to integrate with Prometheus and Grafana. Unlike Elasticsearch, it doesn’t index log contents. It indexes only the metadata (labels) and stores the log lines compressed. At homelab scale, this means dramatically lower storage and memory requirements compared to the ELK stack.
Promtail is the log collector agent that runs as a DaemonSet on every cluster node. It reads container logs via the kubelet’s log directory, attaches Kubernetes metadata labels (namespace, pod name, container name), and pushes them to Loki.
The data flow is simple:
flowchart LR
    subgraph Nodes["Every Cluster Node"]
        C1["Container Logs<br/>/var/log/containers/"]
        PT["Promtail DaemonSet"]
        C1 --> PT
    end

    PT -->|push| LOKI["Loki<br/>(single-binary)"]
    LOKI -->|query| GF["Grafana<br/>Datasource: Loki"]

    style LOKI fill:#f97316,color:#fff
    style GF fill:#e85d04,color:#fff
    style PT fill:#3b82f6,color:#fff
The push model is important. Promtail doesn’t need Loki’s address to be stable or always available. It buffers and retries. When Loki is temporarily unavailable due to a pod restart or a rolling update, Promtail holds the log lines and delivers them once Loki is back.
The Loki stack was deployed in the same session as kube-prometheus-stack, also as a Flux HelmRelease. Together they give you the two halves of observability: quantitative (metrics) and qualitative (logs), both accessible from a single Grafana instance.
The persistent storage decisions
Running Prometheus without persistent storage means losing all your historical metrics every time the pod restarts. This is fine for a quick demo. It’s not fine if you want to look at a week-over-week memory trend when a node starts pressuring, or audit what happened to a pod that OOMKilled three days ago.
The storage decisions made here:
| Component | Storage | StorageClass |
|---|---|---|
| Prometheus | 10Gi | nfs-kubernetes (Synology NAS) |
| Grafana | 2Gi | nfs-kubernetes |
| Loki | 5Gi | nfs-kubernetes |
NFS was the right call for monitoring storage. The data access patterns are append-heavy (metrics time series, log lines) with occasional bulk reads (dashboard queries). NFS latency is perfectly acceptable for this. The alternative, local-path storage, would tie Prometheus to a specific node, making rolling updates more disruptive.
The 10Gi Prometheus size is conservative. Prometheus compresses time-series data well, and with the default 15-day retention window, 10Gi covers a reasonable number of series. For a homelab cluster with roughly 20 applications, this is more than adequate.
These PVCs are declared in the kube-prometheus-stack HelmRelease values:
prometheus:
  prometheusSpec:
    storageSpec:
      volumeClaimTemplate:
        spec:
          storageClassName: nfs-kubernetes
          resources:
            requests:
              storage: 10Gi

grafana:
  persistence:
    enabled: true
    storageClassName: nfs-kubernetes
    size: 2Gi
Grafana access: dual ingress from day one
Grafana was the first application to get dual ingress, the pattern that every subsequent application follows.
LAN access is via ingress-nginx with a nip.io hostname:
https://grafana.10.0.0.201.nip.io
nip.io is a wildcard DNS service: any hostname in the form <anything>.<ip>.nip.io resolves to that IP. This means zero DNS configuration on your router, zero /etc/hosts entries, and every device on the LAN immediately resolves the Grafana hostname.
Remote access is via the Tailscale Kubernetes operator:
https://grafana.homelab.ts.net
The Tailscale Ingress auto-provisions a TLS certificate from Let’s Encrypt and routes traffic through the Tailscale network. No public port forwarding required.
The first time Grafana comes up, it’s protected by a static admin password in the HelmRelease values. That gets replaced with a secret from 1Password via an ExternalSecret in a subsequent session, a foreshadow of the secrets management post. The bootstrap pattern is: get it working first, then close the security gap.
Grafana dashboards are provisioned via ConfigMaps using Grafana’s built-in provisioning mechanism. The kube-prometheus-stack chart ships a sidecar container that watches for ConfigMaps labeled grafana_dashboard: "1" and automatically imports them. Adding a custom dashboard is a matter of dropping a JSON file into a ConfigMapGenerator in monitoring/configs/kustomization.yaml. Flux reconciles it, the sidecar picks it up, and the dashboard appears in Grafana without a pod restart.
Alert noise reduction: the InfoInhibitor pattern
kube-prometheus-stack ships with a large set of default alerting rules. Most are genuinely useful. A few generate noise before you’ve tuned them to your environment.
The first noise problem that emerged wasn’t the alerts themselves. It was a structural gap in the Alertmanager configuration. The stack ships with an InfoInhibitor alert: a synthetic alert that fires whenever any severity=info alert is active. Its purpose is to be the source of an inhibit_rules entry in Alertmanager, suppressing all info-severity alerts from reaching your notification channel. Without the corresponding inhibit_rules configuration, the InfoInhibitor fires and does nothing useful.
The fix is the standard inhibit_rules block in the Alertmanager config (PR #153):
alertmanager:
  config:
    inhibit_rules:
      - source_matchers:
          - 'alertname = "InfoInhibitor"'
        target_matchers:
          - 'severity = "info"'
        equal:
          - namespace
This tells Alertmanager: “whenever an InfoInhibitor is active in namespace X, suppress all severity=info alerts in namespace X.” The net result: CPUThrottlingHigh, which is an info-severity alert, routes to the null receiver and never pages anyone. The Prometheus docs have the full reference for inhibit_rules configuration.
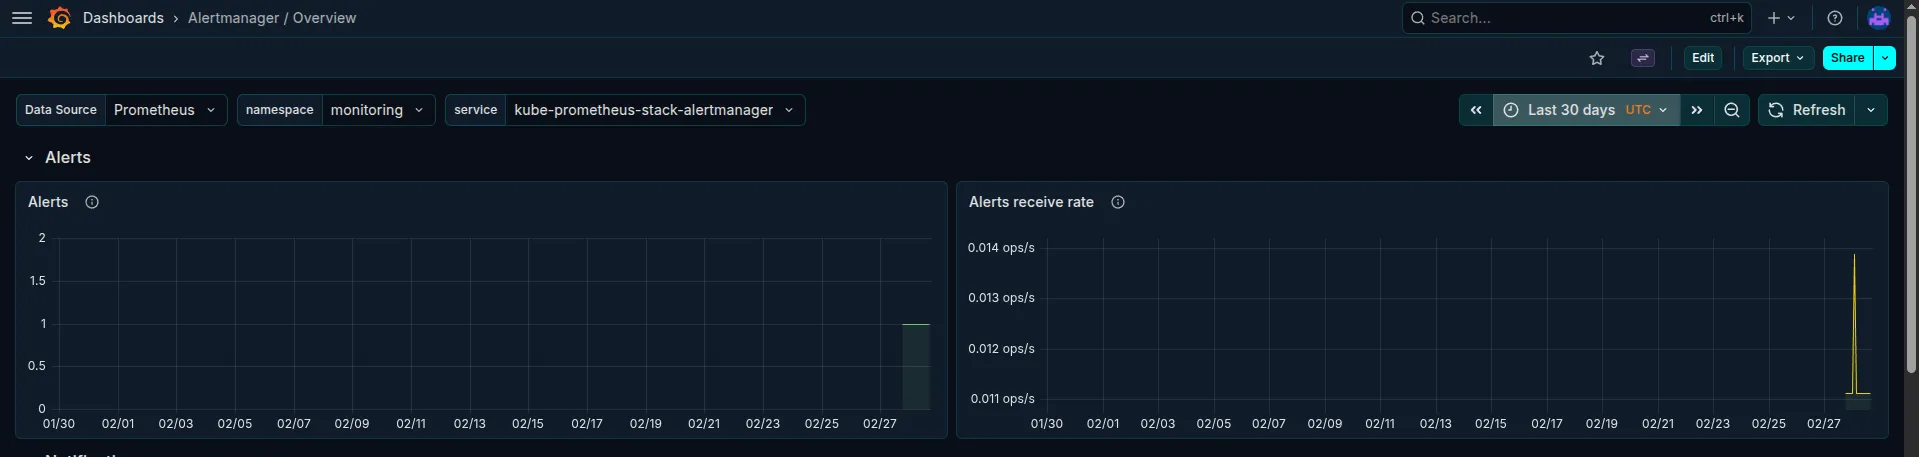 Alertmanager over 30 days. Only a handful of alerts in the entire period. The InfoInhibitor pattern keeps info-severity noise from reaching the notification channel.
When a real alert does fire, it reaches Slack immediately via the #homelab-alerts channel:
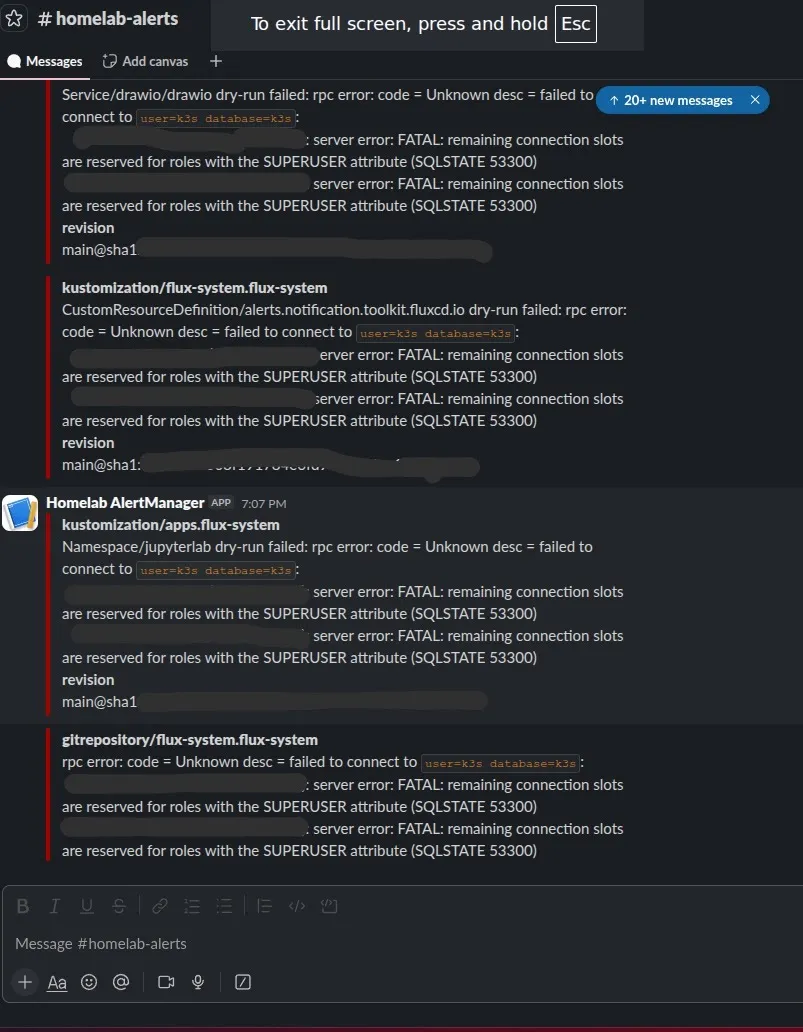 PostgreSQL connection slots exhausted across multiple kustomizations — a real operational alert that bypassed the InfoInhibitor because it was warning-severity, not info. The monitoring stack paged. The problem got fixed.
The second noise problem was the Wiki.js CPUThrottlingHigh alert itself. Wiki.js was running against a 1000m CPU limit and throttling at 67-76%. The root cause wasn’t a misconfiguration or a memory leak. It was an intentionally tight limit being hit by normal Node.js burst behavior. Wiki.js starts background Git sync jobs, runs garbage collection, and processes requests in bursts. A 1-core ceiling is too low for this kind of application.
The fix was raising the CPU limit from 1000m to 2000m while leaving the request at 100m. That’s a 20:1 gap between request and limit, which is worth explaining.
A general resource sizing approach that works well for new deployments: start with requests at 100m CPU and 64Mi memory, watch for CPUThrottlingHigh alerts and OOMKilled events over the first 48 hours, then set limits at roughly 4x the observed peak usage. This gives burst headroom without wildly over-allocating on the scheduler side. The AI can suggest the formula; the observed peak data has to come from your environment: Grafana’s pod resource dashboard is where you read it.
The request/limit philosophy
Kubernetes resource requests and limits serve different purposes:
- Requests tell the scheduler how much CPU/memory to reserve when placing the pod on a node. If every pod is honest about its steady-state needs, the scheduler can pack nodes efficiently without oversubscription.
- Limits are the hard ceiling. A container that tries to use more CPU than its limit is throttled. A container that exceeds its memory limit is OOMKilled.
For steady-state applications, like a REST API server, a database, or a queue consumer, keeping requests and limits close together gives you predictable performance and accurate scheduler placement.
For bursty applications, like Node.js runtimes with GC pauses, JVM processes with periodic heap compaction, or Grafana itself with rendering spikes during dashboard loads, a large gap is appropriate. The steady-state CPU might be 50m, but the burst ceiling might be 2000m. Setting the limit to 100m would cause constant throttling during normal operation. Setting the request to 2000m would cause Kubernetes to refuse to schedule the pod unless a node has 2 cores idle for it.
The pattern for bursty apps: low requests (for scheduler placement), high limits (for burst headroom). The key constraint is that the cluster as a whole has spare capacity to absorb those bursts. In a homelab with 12-16 cores per node and 20 applications sharing the cluster, this is generally true.
This philosophy shapes every resource block written for subsequent applications. Knowing it early prevents a lot of alert noise later.
The ServiceMonitor pattern
Once the monitoring stack is running, adding an application to Prometheus requires two things:
- The application exposes a
/metricsendpoint in Prometheus format. - A
ServiceMonitorresource tells Prometheus where to find it.
kube-prometheus-stack installs the ServiceMonitor CRD as part of the prometheus-operator. The CRD lets you describe a scrape target declaratively:
apiVersion: monitoring.coreos.com/v1
kind: ServiceMonitor
metadata:
  name: my-app
  namespace: my-app
spec:
  selector:
    matchLabels:
      app: my-app
  endpoints:
    - port: metrics
      interval: 30s
      path: /metrics
One critical gotcha: by default, prometheus-operator only discovers ServiceMonitors in its own namespace or those matching its serviceMonitorSelector. ServiceMonitors in application namespaces are silently ignored.
The fix is setting an empty serviceMonitorNamespaceSelector in the HelmRelease values:
prometheus:
  prometheusSpec:
    serviceMonitorNamespaceSelector: {}  # empty = discover all namespaces
With this set, any ServiceMonitor in any namespace is automatically picked up. The Proxmox VE exporter, the GitHub Actions exporter, and application-specific exporters all follow this pattern: deploy a ServiceMonitor alongside the application, and Prometheus starts scraping it.
The value compounds over time. By the time the cluster has 20 applications, you have a unified metrics view across everything, including K3s nodes, Proxmox hypervisors, PostgreSQL, and application-level request rates, all queryable from a single Prometheus instance and visualized in Grafana.
AI Collaboration Note
What Claude contributed: The inhibit_rules configuration was a good example of AI-assisted debugging working well. After opening a GitHub issue about persistent InfoInhibitor alerts, Claude correctly identified that kube-prometheus-stack ships the alert but not the corresponding Alertmanager suppression rule. It produced the exact
inhibit_rulesYAML block and explained thesource_matchers/target_matchers/equalsemantics correctly on the first attempt.Where it needed correction: The first draft of the Alertmanager routing config used a global catch-all route sending everything to Slack, which was generating constant Watchdog heartbeat noise. Claude’s suggestion was to add an explicit Watchdog route to a null receiver. That’s correct in principle, but it missed the deeper issue: the default routing structure should be whitelist-based (only route warning/critical alerts explicitly) rather than blacklist-based (route everything, suppress specific alerts). The whitelist approach was identified during review and required rewriting the entire route tree, not just patching a single matcher.
Prompt that worked: “The Alertmanager InfoInhibitor alert is firing but not suppressing anything. What’s the correct inhibit_rules configuration for kube-prometheus-stack, and where does it go in the HelmRelease values?”
Using a different AI tool? The key here is being specific about which component’s configuration you’re targeting (the HelmRelease values, not the Alertmanager ConfigMap directly). Any model that knows kube-prometheus-stack should handle this correctly. If it suggests editing Kubernetes Secrets directly, redirect it to the HelmRelease values approach.
Lessons
-
Deploy monitoring before applications. The first application deployment always produces surprises. You want metrics and logs available to debug them in the moment, not afterwards.
-
kube-prometheus-stack is the right default. The bundled dashboards, rules, and integrations save weeks of manual wiring. Override the defaults as you learn your environment. Don’t rebuild from scratch.
-
Prometheus without persistent storage is Prometheus without memory. You can’t look at a week-over-week trend, can’t audit what happened before a pod restart, and can’t correlate an OOMKill from three days ago with today’s symptoms. Treat Prometheus storage as a first-class requirement, not an afterthought.
-
The InfoInhibitor requires an explicit inhibit_rules block to work. kube-prometheus-stack ships the alert without the Alertmanager rule, a documentation gap that causes confusion. Add
inhibit_rulesto your Alertmanager config from day one. -
Set
serviceMonitorNamespaceSelector: {}in prometheus-operator configuration. Without it, ServiceMonitors in application namespaces are silently ignored, a silent failure mode that’s hard to notice until you wonder why an app’s metrics aren’t appearing. -
The one gap in this stack: there are no alerts for when Prometheus or Loki themselves go down. If the monitoring stack fails, you’ll notice because Grafana is blank, not because an alert fired. For a homelab this is acceptable; for a team environment, consider a simple external uptime check on Grafana’s health endpoint.
Next: Post 6 — SSO for Everything: Keycloak and OAuth2 Proxy — centralizing authentication before you have more than two apps.