Homelab as Production/Part 13 of 16
Three Sessions to Fix OIDC SSO — A Debugging Arc
How a 'simple' SSO integration turned into a JVM truststore, CORS, and a Jetty runtime discovery
I want to tell you about the most instructive three sessions of this entire project.
Not the most satisfying. The PostgreSQL HA failover was more satisfying. Not the most technically ambitious. The K3s upgrade arc wins that. This one was instructive because it was layered. Each time I thought I’d fixed the problem, the system revealed that I’d been solving the wrong layer. Three sessions. Three completely distinct root causes. One login button that refused to appear.
Who knew that OIDC could be so difficult with different applications (he said sarcastically).
This is the story of getting OIDC SSO working on OWASP Dependency-Track, and what it taught me about debugging complex systems with AI assistance.
The Setup: Why Dependency-Track
By session 41, I had been running the homelab for several months with a growing application roster: Grafana, n8n, Wiki.js, AFFiNE, Windmill, TeamCity, GitLab. Every application had SSO wired through Keycloak. The infrastructure was producing real artifacts.
The missing piece was software supply chain visibility. My GitLab CI pipeline was building and deploying things. I had no formal way to track what container images were running, which had known CVEs, or how my dependency landscape was changing over time. OWASP Dependency-Track is the answer to that question: an open-source platform for component analysis that ingests CycloneDX SBOMs and continuously monitors them against vulnerability databases.
The deployment plan had two parts: stand up the application with external PostgreSQL and dual ingress, following the same pattern as every other app, and wire in OIDC SSO using Dependency-Track’s native OIDC support rather than oauth2-proxy.
Part one took an afternoon. Part two took three sessions.
Act 1 — Session 41: The Setup
Deployment
Dependency-Track ships in two packaging options: a split image pair (dependencytrack/apiserver + dependencytrack/frontend) or a dependencytrack/bundled image that runs both the Java API server and the Nginx-served frontend in a single container on port 8080. For a homelab cluster where operational simplicity matters, bundled is the right choice.
The deployment manifest followed the established pattern. External PostgreSQL via the HA VIP. A 10Gi NFS PVC for vulnerability data. A startupProbe with a 10-minute window because Dependency-Track runs Liquibase database migrations on first boot and will be killed by a naive readiness check. Node affinity to the highest-RAM node in the cluster.
One DT-specific wrinkle: JVM heap is configured via ALPINE_MEMORY_MAXIMUM, not the standard JAVA_OPTS. The container memory limit needs to be the heap size plus JVM overhead, including GC buffers, class metadata, and thread stacks. The working formula is limit = heap + 2Gi. I set ALPINE_MEMORY_MAXIMUM: 6g and limits.memory: 8Gi.
env:
  - name: ALPINE_DATABASE_MODE
    value: external
  - name: ALPINE_DATABASE_URL
    value: "jdbc:postgresql://10.0.0.44:5432/dependencytrack"
  - name: ALPINE_MEMORY_MAXIMUM
    value: 6g
DT was up. The UI loaded. Vulnerability feeds were syncing. PR #160 merged.
The SBOM Pipeline
The companion to DT is a CI job that produces and uploads the SBOM. I wrote scripts/ci/generate-sbom.sh as a standalone Bash script that does three things:
- Extracts all container image references from Kubernetes manifests using
yq. Everycontainers[].imageandinitContainers[].imagein the cluster. - Parses each image into a CycloneDX 1.4
pkg:ociPURL using a short Python3 inline script. Python handles the URL encoding robustly where bash string manipulation gets messy. - Assembles the CycloneDX JSON document and uploads it to DT via
PUT /api/v1/bom.
The SBOM upload endpoint accepts base64-encoded BOM content in a JSON body, not a multipart form upload as you might expect. autoCreate: true in the body creates the DT project if it doesn’t exist yet.
One security detail: the DT API key is written to a curl --config temp file rather than passed via -H on the command line. This keeps the token out of process listings (ps aux, /proc/<pid>/cmdline). The temp file is cleaned up by a trap cleanup EXIT handler.
DT found 27 unique container images across all my deployed applications and platform controllers. That’s the inventory I’d been running blind on.
The First OIDC Attempt
Dependency-Track has native OIDC support. The DT documentation describes it as a public PKCE client. No client secret is required, and the browser initiates the flow directly with Keycloak. This is the correct architecture for a single-page application: the server never holds a secret that could be compromised.
Configuration looked simple: set ALPINE_OIDC_ENABLED=true, ALPINE_OIDC_CLIENT_ID, and ALPINE_OIDC_ISSUER. Create a Keycloak client. Point them at each other.
I added the environment variables, created the Keycloak client with PKCE enabled, deployed the change. The DT API endpoint /api/v1/oidc/available returned true. I reloaded the UI.
No SSO button.
I checked the endpoint again. Still true. I checked the Keycloak client configuration. Looked correct. I restarted the pod. Still no button.
This is the moment where the debugging arc began.
Act 2 — Session 42: The JVM Rabbit Hole
The First False Lead
The homelab uses a private CA for internal TLS certificates. Every nginx ingress, including the Keycloak endpoint, is signed by this CA. When I checked the DT API logs, I found nothing obviously wrong. The /api/v1/oidc/available endpoint was returning true, which told me the API thought OIDC was configured. But the SSO button is rendered by the frontend, which checks OIDC discovery separately.
My first hypothesis was TLS. DT has an environment variable for exactly this situation: ALPINE_HTTPS_TRUST_ALL_CERTIFICATES=true. The documentation describes it as disabling TLS verification for HTTPS connections.
I added it. Deployed PR #173. Waited for the rollout. Reloaded.
Still no button.
The Actual Root Cause
This is where it got interesting.
Claude’s hypothesis, when I described the symptom, was to look more carefully at which HTTP client was making the OIDC discovery request. DT is a Java application. It has multiple HTTP client implementations in play. The ALPINE_HTTPS_TRUST_ALL_CERTIFICATES flag controls the trust behavior of DT’s internal HttpUtil class. But the component responsible for resolving OIDC configuration, the OidcConfigurationResolver, uses java.net.HttpURLConnection. That’s the JVM’s default HTTP client. It uses the JVM’s default SSLContext. And the JVM’s default SSLContext knows nothing about your homelab CA cert.
The JVM was trying to fetch https://keycloak.homelab.ts.net/.well-known/openid-configuration. The homelab CA wasn’t in the JVM trust store ($JAVA_HOME/lib/security/cacerts). The connection was failing with PKIX path building failed. And because this failure happened during startup, before the pod was serving requests, it left no error visible in normal operation. The API still returned available: true because that endpoint only checks whether OIDC is configured, not whether discovery succeeded.
AI Collaboration Note What Claude contributed: The hypothesis that
ALPINE_HTTPS_TRUST_ALL_CERTIFICATESand the JVM SSLContext are separate trust mechanisms was surfaced quickly and precisely. Claude identifiedOidcConfigurationResolveras the likely culprit and proposed thekeytool+JAVA_TOOL_OPTIONSfix pattern before I would have found it through log analysis alone. Where it needed correction: Claude’s first instinct was to useJAVA_OPTSrather thanJAVA_TOOL_OPTIONS. In this image,JAVA_TOOL_OPTIONSis the correct variable. It’s respected by the JVM before the application has a chance to override it. I caught this by checking what the image actually used. Prompt that worked: “DT returns/api/v1/oidc/available: truebut the SSO button doesn’t appear.ALPINE_HTTPS_TRUST_ALL_CERTIFICATES=trueis set. The Keycloak TLS cert is signed by a private CA. What part of the DT Java stack might be making the OIDC discovery call separately fromHttpUtil?” Using a different AI tool? The key is asking about the specific component making the HTTPS call, not about the application as a whole. Any LLM with Java knowledge should be able to identify the JVM SSLContext vs application HTTP client distinction if the question is scoped correctly.
The Fix
The solution required two pieces.
First, an init container that copies the JVM trust store, imports the homelab CA cert, and writes the result to an emptyDir volume:
initContainers:
  - name: trust-homelab-ca
    image: dependencytrack/bundled:4.13.6
    command:
      - sh
      - -c
      - |
        cp /opt/java/openjdk/lib/security/cacerts /truststore/cacerts
        keytool -import -trustcacerts -noprompt \
          -alias homelab-ca \
          -file /etc/ssl/homelab/ca.crt \
          -keystore /truststore/cacerts \
          -storepass changeit
    volumeMounts:
      - name: truststore
        mountPath: /truststore
      - name: homelab-ca
        mountPath: /etc/ssl/homelab
        readOnly: true
The homelab CA certificate is delivered via a ConfigMap mounted into the init container. The Java keytool documentation covers the import command format. The default JVM trust store password is changeit.
Second, the main container is told to use the modified trust store via JAVA_TOOL_OPTIONS:
env:
  - name: JAVA_TOOL_OPTIONS
    value: "-Djavax.net.ssl.trustStore=/truststore/cacerts -Djavax.net.ssl.trustStorePassword=changeit"
PR #174 deployed. Pod rolled. I watched the logs.
INFO [o.d.c.p.OidcConfigurationResolver] OIDC configuration successfully loaded.There it was. The OIDC configuration was loading. The JVM could now reach Keycloak’s discovery endpoint. /api/v1/oidc/available still returned true.
I reloaded the UI.
Still no button.
Two sessions in, I had a functioning JVM trust chain and confirmed OIDC discovery was loading. The system was doing more than it had before. It was still not doing the thing I needed. The honest feeling at that point was something between determination and dread, the kind you get when you’ve fixed two things that were definitely broken and the problem is still there. The bounded-session model was tested hardest right here: the obvious move was to keep going, to push into Session 43 without stopping, because the fix felt close. I didn’t. Session 42 ended with a commit documenting what was confirmed working and what remained unknown. The next session started with that written record, not just with memory.
Act 3 — Session 43: The Jetty Discovery
OIDC Discovery Succeeds. Button Still Missing.
At this point, I had confirmed:
- The DT API has OIDC configured (
/api/v1/oidc/available: true) - The JVM successfully loads OIDC configuration from Keycloak (
OidcConfigurationResolverlog line) - No TLS errors in the pod logs
The SSO button is a frontend concern. The DT single-page application reads a config.json file at startup to determine what OIDC parameters to use. My hypothesis became: the frontend isn’t getting the right config.
I looked at the environment variables I’d set: ALPINE_OIDC_CLIENT_ID, ALPINE_OIDC_ISSUER. These configure the Java backend. But the frontend, the browser-side React application, needs to read these values separately. How does it get them?
In the standalone deployment pattern (dependencytrack/frontend image), a shell entrypoint script reads environment variables and writes them into config.json before Nginx serves the static files. It’s a standard pattern for containerized frontend applications.
The bundled image doesn’t work this way.
The Discovery
There is no entrypoint.sh in the dependencytrack/bundled image. The image runs java -jar dependency-track-bundled.jar directly. There is no shell script phase. There is no mechanism to inject environment variables into the frontend config.
Finding this required getting into the container directly: kubectl exec -it <pod> -- /bin/sh, then running find /tmp -name config.json. The result came back as a path under /tmp/jetty-0_0_0_0-8080-dependency-track-bundled_jar-_-any-<hash>/webapp/static/config.json. Opening that file and seeing "OIDC_CLIENT_ID": "" was the moment the problem snapped into focus. The configuration wasn’t missing. It was there, and it was empty by design. The file had never been intended to contain runtime values in the bundled image; it was baked in at build time with empty strings as placeholders. This is the kind of multi-layer problem where human investigation (exec into the pod, find the file, read it) found what no amount of code review, log analysis, or documentation reading would have surfaced. The path itself only exists after Jetty has already started and extracted the JAR to an unpredictable location.
The config.json file that the frontend reads isn’t in a known static location. It’s baked into the JAR at image build time, with empty OIDC values:
{
  "OIDC_CLIENT_ID": "",
  "OIDC_ISSUER": "",
  "OIDC_FLOW": "code",
  "OIDC_SCOPE": "openid email profile"
}
When the application starts, Jetty, the embedded web server, extracts the JAR contents to a temporary working directory. The path of that directory is dynamically generated:
/tmp/jetty-<random>-8080-dependency-track-bundled_jar-_-any-<random>/webapp/static/config.jsonBoth <random> components change on every container start. There’s no stable path you can mount a ConfigMap override to. The conventional Kubernetes approach, “mount a volume at the config file path,” doesn’t work because you don’t know the path until after Jetty has already started.
AI Collaboration Note What Claude contributed: Claude identified the Jetty extraction behavior as the likely mechanism after I described the symptoms: “env vars set, API reports success, frontend shows wrong behavior.” The suggestion to exec into the running container and search for
config.jsonunder/tmpwas the critical step that confirmed the hypothesis. Where it needed correction: Claude’s first proposed fix was to setOIDC_CLIENT_IDandOIDC_ISSUERas environment variables (standard practice for the standalone frontend image). I had to explain that the bundled image has no entrypoint to consume them, which reframed the problem entirely. Prompt that worked: “I’ve exec’d into the DT bundled container.find /tmp -name config.jsonshows a file at/tmp/jetty-0_0_0_0-8080-dependency-track-bundled_jar-_-any-<hash>/webapp/static/config.json. The OIDC fields are empty strings. How do I patch this file at startup when I don’t know the path in advance?” Using a different AI tool? The exec-into-container diagnostic step is essential and has nothing to do with AI. The question of “how do I act on a file at an unknown path” is well-suited to any general-purpose coding assistant.
The Fix: A Polling Lifecycle Hook
Kubernetes lifecycle hooks fire after a container starts. The postStart hook runs a command in the container immediately after it enters the Running state. This is the mechanism that makes the fix possible: we don’t need to know the path in advance, because by the time the hook runs, Jetty will eventually have extracted the file.
“Eventually” is the operative word. Jetty doesn’t extract the JAR contents instantaneously. The hook needs to wait. The solution is a polling loop:
lifecycle:
  postStart:
    exec:
      command:
        - /bin/sh
        - -c
        - |
          i=0
          while [ $i -lt 60 ]; do
            f=$(find /tmp -maxdepth 5 -path '*/webapp/static/config.json' 2>/dev/null | head -1)
            if [ -n "$f" ]; then
              sed -i 's|"OIDC_CLIENT_ID": ""|"OIDC_CLIENT_ID": "dependency-track"|' "$f"
              sed -i 's|"OIDC_ISSUER": ""|"OIDC_ISSUER": "https://keycloak.homelab.ts.net/auth/realms/homelab"|' "$f"
              exit 0
            fi
            sleep 2
            i=$((i + 1))
          done
          exit 0
The hook polls up to 60 times with 2-second sleeps, a 120-second window. When it finds the file, it patches the two empty OIDC fields in-place using sed -i and exits 0. If the timeout is reached without finding the file, it exits 0 anyway: the OIDC button simply won’t appear, but the container doesn’t restart. The exit 0 is intentional. If the hook exits 1, Kubernetes treats the container as failed and restarts it in a loop, which means the hook would be retrying indefinitely rather than letting the application start and log the failure normally. Exiting 0 means “hook ran, whatever happened happened” and the application continues starting; a patching failure manifests as a missing SSO button, not a crash loop.
One subtlety: postStart hooks run asynchronously with the container entrypoint. The Kubernetes documentation notes that there is no ordering guarantee between the hook and the container’s own startup. In practice, the JVM takes several seconds to initialize, which gives the hook enough time to begin polling before Jetty extracts the JAR. But the poll loop exists precisely because we can’t rely on that timing.
PR #182 deployed. Pod rolled. I reloaded the UI.
The SSO button appeared.
I clicked it.
The PKCE Flow
Before describing what happened next, it’s worth explaining the authentication flow that was about to execute. This is a PKCE flow, Proof Key for Code Exchange. PKCE is the correct pattern for public clients, meaning applications that can’t safely store a client secret, such as single-page apps and mobile apps.
sequenceDiagram
    participant Browser
    participant DT_API as DT API<br/>/api/v1/oidc/*
    participant Keycloak

    Browser->>DT_API: GET /api/v1/oidc/available
    DT_API-->>Browser: {"available": true}
    Note over Browser: Reads config.json for<br/>client_id, issuer, scope

    Browser->>Browser: Generate code_verifier + code_challenge (S256)
    Browser->>Keycloak: GET /authorize?response_type=code<br/>&client_id=dependency-track<br/>&code_challenge=...&code_challenge_method=S256
    Keycloak-->>Browser: Login page

    Browser->>Keycloak: POST /login (credentials)
    Keycloak-->>Browser: 302 redirect with auth code<br/>to DT callback URL

    Browser->>Keycloak: POST /token (XHR)<br/>code + code_verifier
    Note over Browser,Keycloak: CORS enforced here —<br/>browser checks Access-Control-Allow-Origin

    Keycloak-->>Browser: access_token + id_token
    Browser->>DT_API: POST /api/v1/user/oidc/login<br/>Bearer: id_token
    DT_API-->>Browser: DT session token
    Note over Browser: Authenticated
The key architectural point: the browser performs the token exchange directly with Keycloak via XHR. There’s no server-side component handling this exchange. This means the browser’s CORS enforcement applies, and CORS is enforced by the browser, not the server. The server simply needs to include the correct Access-Control-Allow-Origin header in its response.
The CORS Error
The redirect returned from Keycloak. The browser followed it back to Dependency-Track. Then the browser’s developer console showed a red error:
Access to XMLHttpRequest at 'https://keycloak.homelab.ts.net/auth/realms/homelab/protocol/openid-connect/token'
from origin 'https://dependencytrack.homelab.ts.net' has been blocked by CORS policy:
No 'Access-Control-Allow-Origin' header is present on the requested resource.
I had configured Keycloak with the correct Redirect URIs for the DT client. The redirect worked, the auth code arrived back at the DT callback URL. But the subsequent XHR token exchange failed with a CORS error.
The distinction matters. Redirect URIs and Web Origins are separate fields in a Keycloak client configuration, and they control different things:
- Redirect URIs govern where Keycloak will send the user after authentication. They are a security boundary: Keycloak will not redirect to an unlisted URI.
- Web Origins govern which origins receive
Access-Control-Allow-Originheaders in Keycloak’s CORS responses. They are an entirely separate list.
A Keycloak client configured with correct Redirect URIs but empty Web Origins will successfully redirect the user back to the application, and then CORS-block the XHR token exchange that the browser needs to complete immediately after.
In a PKCE flow, the browser is the one making the /token request, and the browser enforces CORS. Without the correct Access-Control-Allow-Origin header in Keycloak’s response, the browser blocks the response from the page JavaScript, and the login fails. The auth code was valid. The flow simply couldn’t complete.
The fix: in the Keycloak client configuration, set Web Origins to + (Keycloak’s shorthand for “inherit from Redirect URIs”) or list each DT origin explicitly. The Keycloak documentation explains both options under OIDC client settings.
I added the DT origins. Reloaded. Clicked the button. Followed the redirect. Entered credentials. Returned to DT.
Logged in. An empty dashboard.
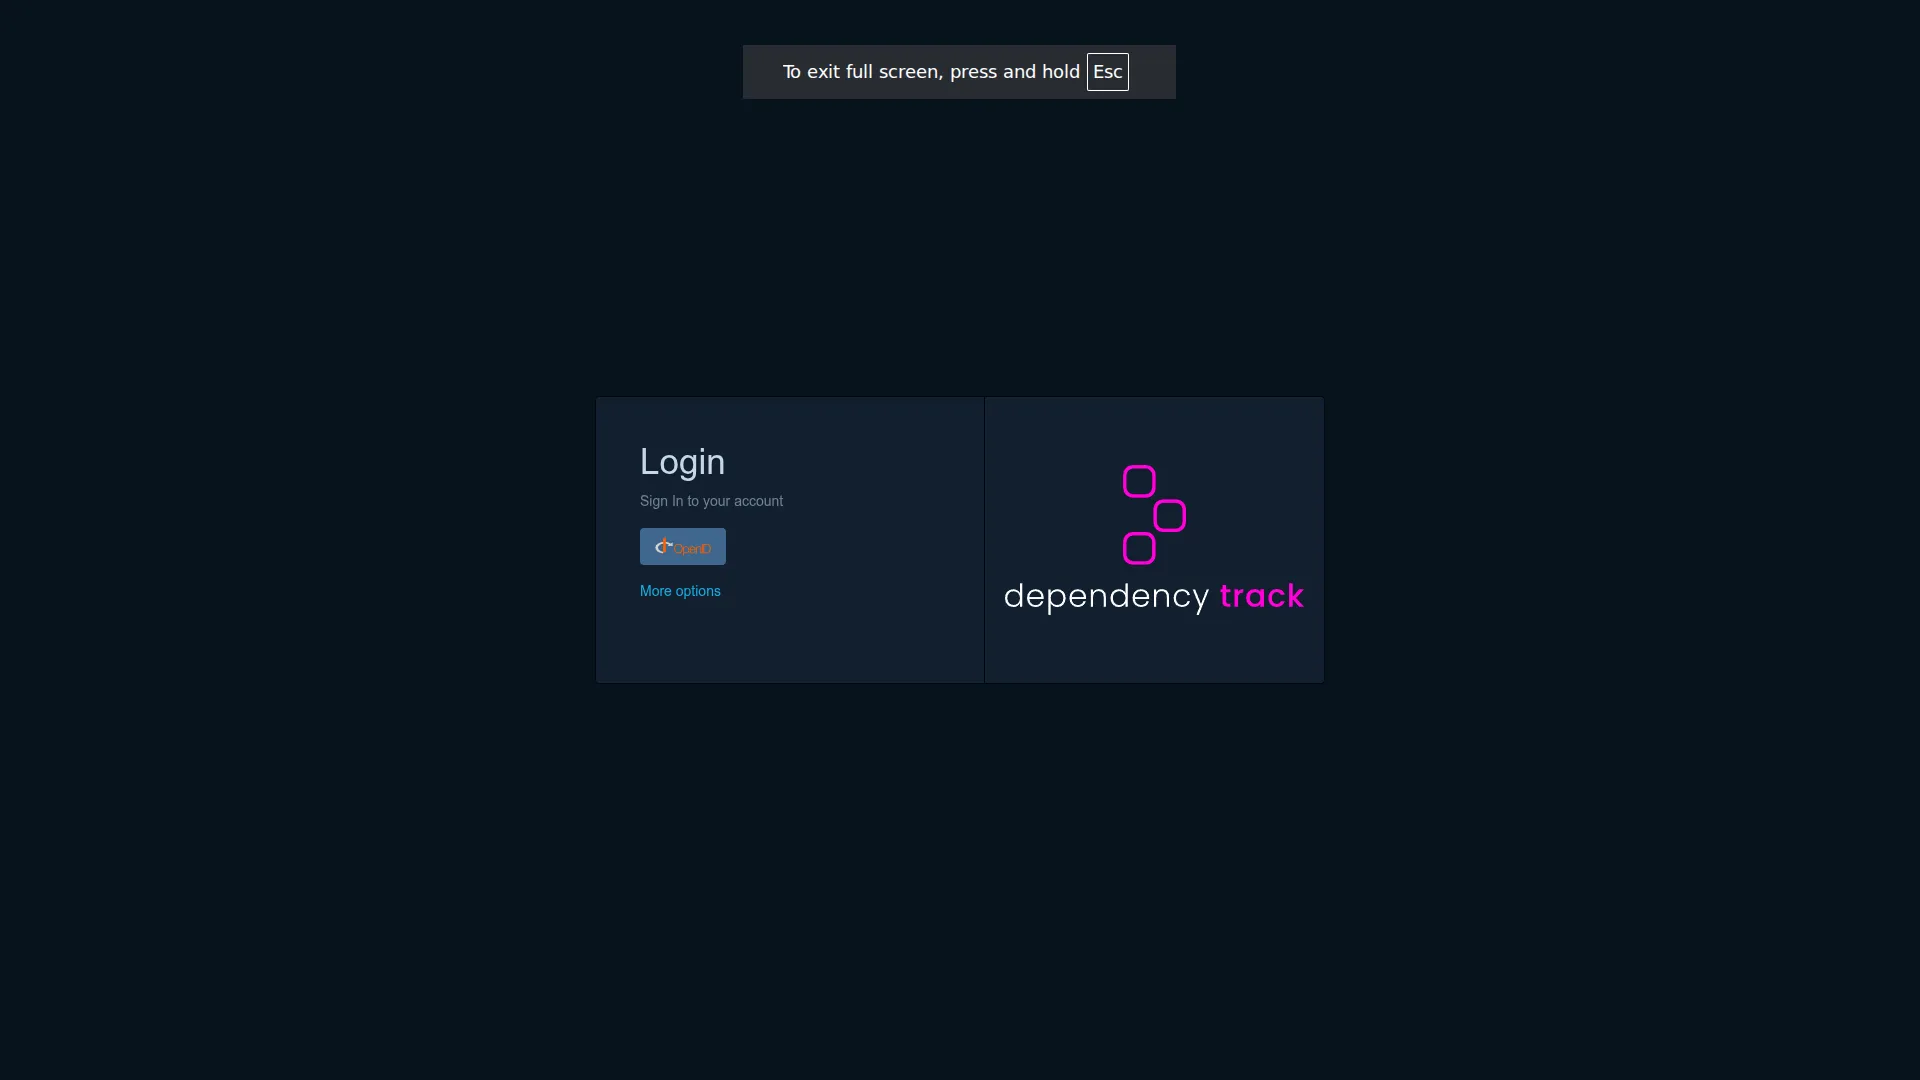 The Dependency-Track login page with the SSO button present. The result after three sessions spent in JVM truststore paths, Keycloak CORS settings, and a Jetty runtime extraction race condition.
The Permissions Discovery
ALPINE_OIDC_USER_PROVISIONING=true was set. The documentation says it auto-creates DT user accounts on first SSO login. It does exactly that, and nothing more.
The auto-created account has no team membership, no permissions, no project access. The user logs in and sees a blank dashboard because they have access to exactly nothing. This is expected behavior. The DT permission model is team-based: users belong to teams, teams have permissions. A freshly provisioned SSO user needs to be manually added to a team by an administrator.
I navigated to Administration, then Access Management, then Teams, found the auto-provisioned account, and assigned it. The dashboard populated.
For production deployments, DT supports ALPINE_OIDC_TEAMS_PROVISIONING=true, which handles automatic team assignment based on OIDC group claims from Keycloak. That requires a Keycloak group mapper on the client and a corresponding OIDC Mapping on the DT team. The configuration is commented out in the deployment manifest for future use.
The Three Layers, Summarized
The debugging arc resolved into three completely independent failure modes, each at a different layer of the stack:
Layer 1: JVM SSLContext (Session 42)
ALPINE_HTTPS_TRUST_ALL_CERTIFICATES controls DT’s application-level HTTP client. The JVM’s OidcConfigurationResolver uses java.net.HttpURLConnection, a separate HTTP client with a separate trust context. A self-signed CA cert must be imported into the JVM trust store via keytool and the JVM must be pointed at the modified store via JAVA_TOOL_OPTIONS. Application-level TLS flags do not propagate to JVM-level HTTP clients.
Layer 2: Baked-in JAR Config (Session 43)
The dependencytrack/bundled image has no entrypoint.sh. Frontend config is baked empty into the JAR at build time and extracted by Jetty to an unpredictable runtime path. Environment variables that work in the standalone frontend image have no effect in the bundled image. The only reliable patching mechanism is a postStart lifecycle hook with a polling loop.
Layer 3: Keycloak Web Origins (Session 43) In a PKCE flow, the browser performs the token exchange via XHR. CORS is enforced by the browser. Keycloak’s Web Origins field, completely separate from Redirect URIs, controls which origins receive CORS headers. An OIDC client with correctly configured Redirect URIs but empty Web Origins will successfully redirect but fail the token exchange.
Each layer was completely invisible until the layer above it was fixed. The JVM TLS failure prevented OIDC discovery from loading, which made the missing config.json values irrelevant. The missing config values prevented the SSO button from appearing, which made the CORS issue impossible to encounter. The CORS issue was the last gate before working authentication.
The oauth2-proxy Removal
One final cleanup step from Session 43: the DT nginx ingress had been configured with oauth2-proxy annotations from the initial deployment, the standard homelab SSO pattern for applications that don’t have native OIDC support.
With native OIDC working, the oauth2-proxy gate became a problem. Users would hit the oauth2-proxy login first, authenticate there, then hit DT’s own OIDC login. Double authentication. The solution is to remove the oauth2-proxy annotations from the DT nginx ingress entirely, letting DT handle authentication natively. The Tailscale ingress was already direct. Tailscale ingresses don’t use oauth2-proxy.
PR #182 included the annotation removal alongside the initial frontend OIDC fix attempt. The ingress cleanup is a one-time migration per app as native OIDC support is added.
Epilogue: What This Arc Reveals About AI-Assisted Debugging
The three-session arc is a good case study in where AI assistance accelerates debugging and where it doesn’t.
The acceleration came from hypothesis generation. When I described symptoms, “API reports available, logs show success, button still missing,” Claude was fast at proposing the next layer to investigate. The OidcConfigurationResolver hypothesis in Session 42, the Jetty extraction mechanism in Session 43, the CORS/Web Origins distinction when the browser console showed the XHR failure. These are the kinds of cross-cutting knowledge questions that benefit from having broad reference material available immediately.
The limitation was that Claude couldn’t observe the system. Describing a symptom and getting a hypothesis is useful. But the hypotheses need verification against actual pod logs, actual API responses, actual browser console output. The exec -it session that found config.json under /tmp/jetty-<random>/ was not something Claude could do. I had to do it, and the result was what changed the shape of the problem entirely.
The other limitation was that the first proposed fix often solved a slightly different version of the problem. JAVA_OPTS versus JAVA_TOOL_OPTIONS. Redirect URIs versus Web Origins. These distinctions matter in production, and catching them requires understanding the specific components in play, not just the general pattern.
The pattern that worked reliably across all three sessions: describe the symptom precisely, include the specific component version and context, ask about the mechanism rather than the fix. “What HTTP client does DT’s OidcConfigurationResolver use?” surfaces the right answer faster than “why isn’t OIDC working?”
Lessons
1. Application-level TLS bypass flags don’t reach the JVM. Java applications often have multiple HTTP clients in play: application frameworks, OIDC libraries, and the JVM’s built-in HttpURLConnection. Each maintains its own SSL context. Verify which client is making the failing call before applying a fix.
2. The image entrypoint is part of the contract, not an implementation detail. The bundled image has no entrypoint script, which means every deployment pattern that assumes “environment variables flow through an entrypoint.sh” silently fails. When a container image doesn’t behave the way you expect, the entrypoint is the first thing to verify. docker inspect <image> --format '{{.Config.Entrypoint}}' takes five seconds and resolves a category of failures that otherwise take sessions.
3. In PKCE flows, CORS is the browser’s concern. The browser performs the /token XHR directly. Keycloak must include Access-Control-Allow-Origin in the response. Web Origins and Redirect URIs are separate fields that serve separate purposes, so configure both.
4. Failure layers are ordered. When debugging a multi-layer failure, each fix reveals the next failure. The absence of the SSO button was three separate bugs stacked. Fix one, and the next one becomes visible. Expect this in complex systems and treat each fix as a partial victory, not a complete solution.
5. postStart lifecycle hooks can patch files that don’t exist at mount time. Kubernetes volume mounts require a known path. A postStart hook with a polling loop can act on files that are created at runtime by the container process: Jetty-extracted JARs, runtime-generated configs, anything that appears after container startup. This is a useful escape hatch for “I need to modify something the container creates at startup.”
Next: Post 14 — What Claude Got Wrong (And Right) — an honest retrospective on 43 sessions of AI-assisted infrastructure work.
References
- OWASP Dependency-Track documentation
- PKCE — RFC 7636
- Keycloak OIDC client configuration
- Java keytool documentation
- Kubernetes container lifecycle hooks
- CycloneDX SBOM specification
- CORS — MDN Web Docs
This post is part of Homelab as Production: AI-Assisted Infrastructure from Zero to GitOps, a 16-part series on building a production-grade homelab with Terraform, Ansible, FluxCD, and AI-assisted development.